What are website heatmap analytics?
Website heatmaps are essentially visual representations of how visitors interact with specific elements of your website. They give you qualitative data about visitors’ behavior on your website. Heatmaps literally help you track every movement of your website visitors, to help you get a better understanding of their interests, behavior patterns, and preferences.
You can then use these insights to optimize your website for better engagement and higher conversions.
But the question still remains…
How do these powerful website heatmaps help you understand how visitors use your site?
We take you on a deep dive into all the essential features of website heatmaps analytics tools.
Website Heatmap Analytics: How Can Website Heatmaps Help You?
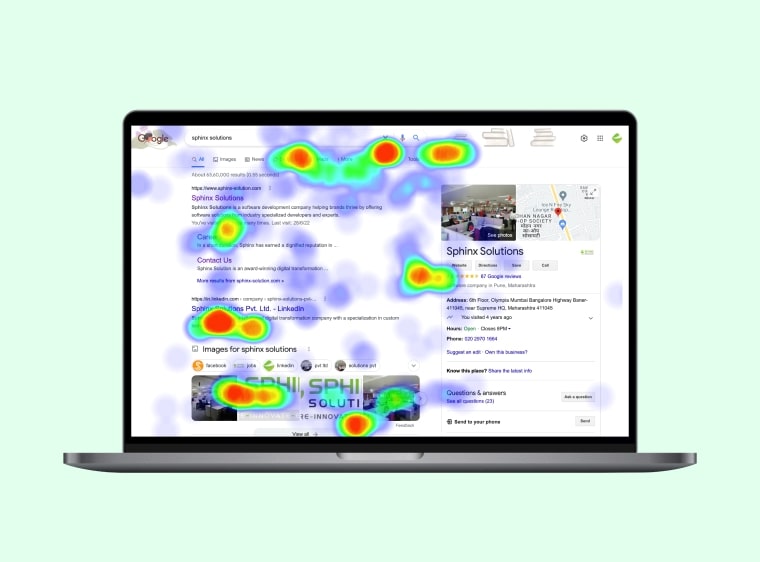
1. Heat maps / Click maps
Site heatmaps (or click maps) essentially show you the areas of your webpage that are getting the most clicks from website visitors.
The data is represented in color, going from red for high data density, to blue for low data density.
So areas that get the most clicks are marked by red splotches. They eventually fade to orange, yellow, green, and eventually blue as the number of clicks reduce.
Purpose / usage of click maps:
- Click maps help you track on-page user engagement. These are actions like clicks on buttons, links, images, text, etc.
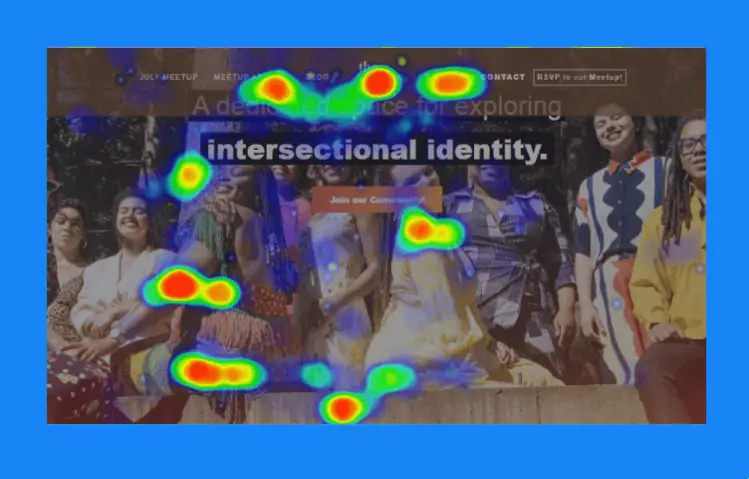
2. Scroll maps
Another popular type of site heatmap is a scroll map.
A scroll map measures the number of views that each section of a webpage gets. They essentially show you how far down a page, users tend to scroll, before dropping off.

Purpose / Usage of scroll maps:
- Scroll maps help you identify the sections of the page that not engaging enough for visitors. With this data, you can work towards reducing drop off rate.
- Based on this data you can modify and change the content of sections on the page.
- They also help you understand the ideal page length for maximum conversions.
For example: If you start to notice that no matter the page content, your website visitors are dropping off after 5-7th section… Then you’ve just identified your visitor’s average scroll capacity.
3. Session replays
Next up, website heatmaps also allow you to gather qualitative website analytics on a granular level.
Some heatmaps tools like Webmaxy, allow you to capture session replays of your website visitors.
These replays allow you and your team to see and learn from the exact behavior of individual visitors or users.
Regular analytics tools help you understand bounce rates, clicks, views, etc.
But a session replay is unique in helping you understand exactly what the user is focusing on, how they are moving through the page, what are they revisiting, and what is potentially causing them to drop off from your page.
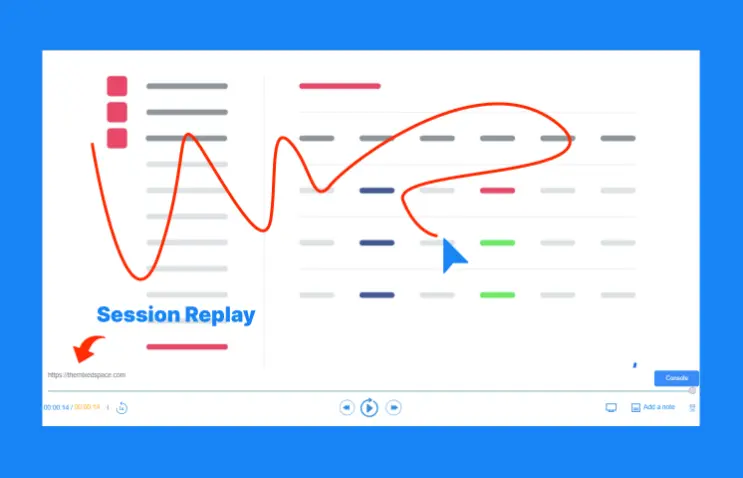
Purpose / usage of session replays:
- Session replays can help you improve your overall website performance.
- They can help you improve your UI, your website copy, the design, and even your overall sitemap.
4. Live sessions
Another popular feature of heatmaps tools, similar to session replays is live sessions.
This feature lets you also look at how users are using or navigating through your website in real-time.
This lets you capture the nuances of real-time back and forth, as users move through your website.
Expanded Capabilities Of Website Heatmap Analytics:
5. Funnel analytics
Many heatmap tools offer features that go beyond just the visual heatmaps.
They also offer analytics of your overall funnel, from the first visit to conversion.
They give you all the stats of where the visitor starts their journey, and how they get to the point of conversion.
These dashboards also give you insights into the percentage of drop-off at each stage of conversion.
This data can help you answer the eternal question of:
“What is the path that our prospects take to get to the point of purchase on the website?”
Or “What pages do users visit before they are ready to buy?”
And “How many people drop off at each stage of the conversion path on the website?”
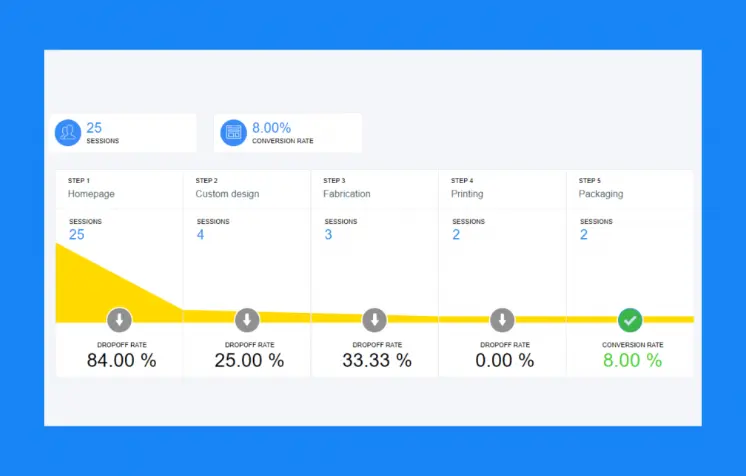
Purpose / usage of funnel analytics:
Based on this crucial information, you will be able to:
- Optimize the conversion path, and make it easier for prospects to get from “hello” to “whipping their wallets out”.
- Understand which sections or pages are acting as the biggest conversion barriers, and need to be fixed.
6. Form analytics
Apart from funnel analytics, some advanced website heatmap tools also give you form analysis.
This feature allows you to get insights into user behavior at each stage of the form-filling process.
It lets you know which questions users aren’t interacting with, and more importantly which sections of the form, most users are dropping off.
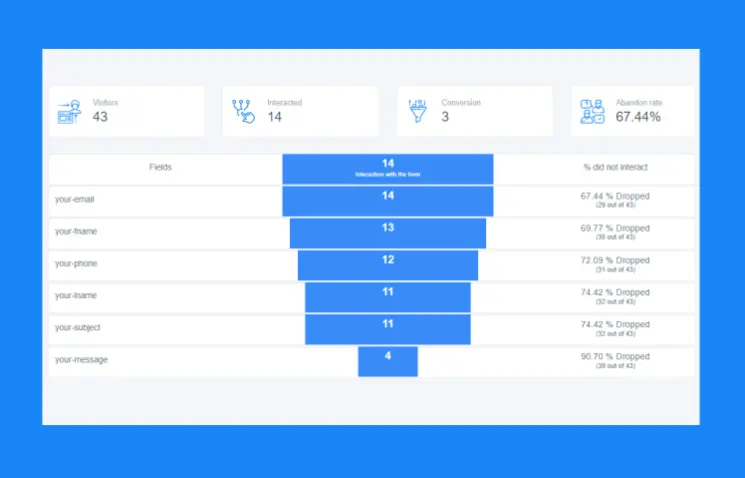
Purpose / usage of form analytics:
As you would expect, form analytics help you optimize the questions on your form for maximum conversions / submissions.
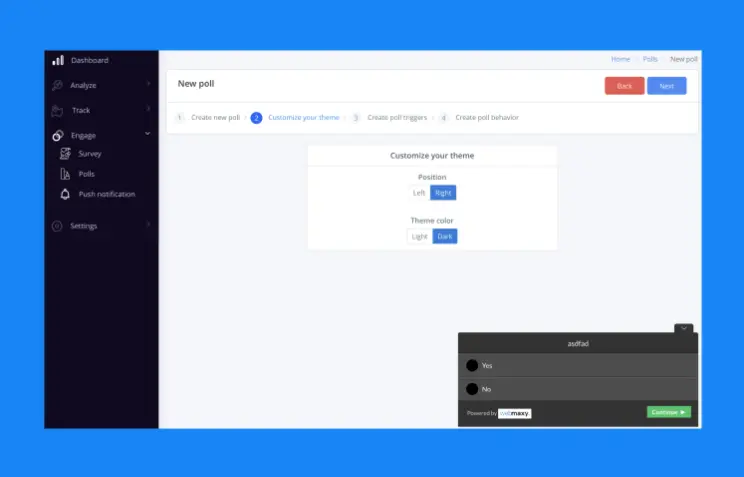
7. Survey and poll analysis
An extension of form analytics is survey and poll analytics.
These tools and features help you easily create on-page surveys and polls for website visitors.
They also help you track the user behavior on these surveys and polls, to help you optimize them for better user engagement. (This could be in terms of design, location, content, length, etc.)
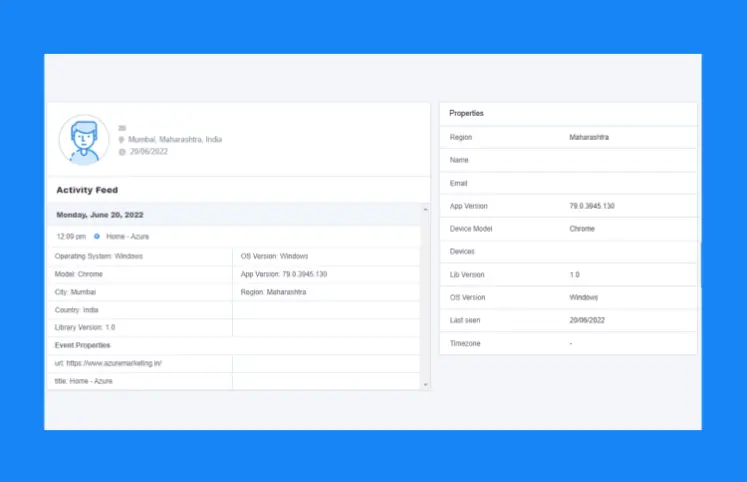
8. User insights
From the heatmap of website, advanced heatmapping tools like Webmaxy also draw out user insights.
These are details like:
- The demographic information of the website visitor
- The visitor’s device type (phone, tablet, laptop)
- Device OS
- Last seen details
- Number of visits, etc.
Purpose / usage of user insights:
- Build a better understanding of where your users are coming from.
- More importantly, they help you understand the differences in navigation and conversion behavior between users of different demographics.
- Design your web pages to better suit the needs and behaviors of visitors based on the devices they use.
And that’s a wrap on the most common website heatmap analytics, and how you can use them to optimize your website performance.
So what are your waiting for?
Get started with a free trial of an easy-to-use website heatmap, to see the difference it can make to your marketing ROI.

FAQ’s
What is a heatmap in website tracking?
A website heatmap is a graphical representation of how website visitors interact with different elements of your website. You can see where the users have clicked on your website. The higher the interaction, the brighter the color of that area.
Can I see a heatmap with Google Analytics?
You can’t view heatmap directly in Google Analytics. However, Page Analytics by Google can help you to generate heatmaps with your Google Analytics data. Heatmaps can help you to analyze your site data with graphical representation.
How do you analyze a heatmap?
You can analyze a heatmap by spotting the areas where users are clicking the most and the CTAs they’re using the least. You can know how users interact and engage with your website. This way, you can understand how you can refine your website to get the maximum user engagement.
Does Google Analytics do heatmap?
Yes, Google Analytics does heatmap not directly but with a Chrome analytics extension called Page Analytics. You need to integrate Google Analytics with Page Analytics (by Google). This way you can create click maps from your Google Analytics data.
Adam Wilson
Adam Wilson comes with an experience of 12+ years in the IT industry. As a Customer Success Manager, he has been researching and trying to understand the customers’ behavior in different scenarios. He has also studied human psychology to relate it to the purchase journey of the customers. His published books on customer psychology and behavior have received many honors and awards from various enterprises.
")

")
