Web analytics heatmap: A comprehensive guide to understanding user engagement

Heatmap analytics is a valuable tool for understanding your users by providing visual representations of how they interact with your website or app.
A web analytics heatmap can help you understand how your users interact and engage with your website. You can visually analyze their clicks, taps, and scrolling behavior on your website. More than 100+ startups, marketers, small businesses, and enterprises are using web analytics heatmap of WebMaxy Analyzer
Web Analytics Heatmap: Track clicks, taps, and scrolls
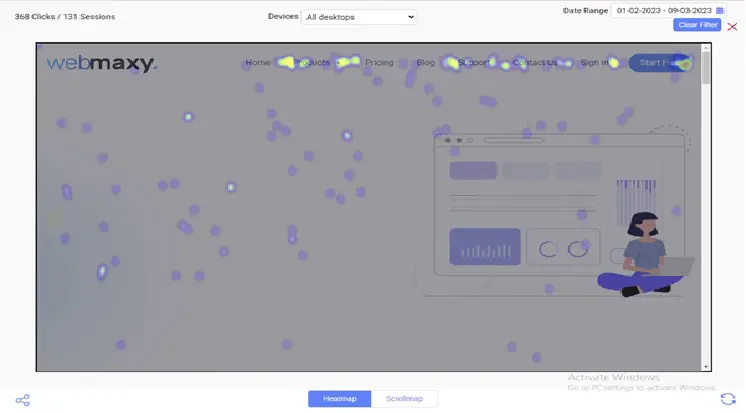
Heat map tracking can give you information about the engagement of your web pages. With web analytics heatmap, you can see the clicks and taps of your website visitors on the different web pages. You can see how much they scroll down on your website
Website heatmap analytics can help you analyze the average drop off rate of your distinct web pages. See with web analytics heatmap where most of your users leave and where you should add a CTA button. You should see if they are clicking on some unclickable elements of your website that you need to replace.
By analyzing the visitor behavior with heatmap website analytics you can discover the scope of improvement. Web analytics heatmap can help you create new opportunities, enhance the user experience, and get more website conversions.
Want to learn more about heatmaps?
Heatmaps can provide you with complete click data information of your website visitors.
Improved team coordination

Most of the time marketing teams rely on guesswork and assumptions to make changes on the website. A heat mapping analytics tool like WebMaxy Analyzer can help you to decide what changes you should priortize first.
By visualizing visitor behavior with a heat map analytics tool, you can build a business based on data-driven decisions. Your teams can coordinate and evaluate the web analytics heatmap together to decide on the changes.
Privacy and protection

A website analytics heat map of WebMaxy Analyzer collects anonymized user behavior. This way you get an insight of visitor behavior while protecting the end-user privacy.
In the analytics heat map, you can’t identify the individual users clicks and taps. This makes it good choice for analyzing visitor behavior and protecting the user data.
Get started with web analytics heatmap
Create web analytics heatmap for different web pages with the WebMaxy Analyzer heatmap feature. Trusted by more than 500+ users for collecting analytics heat maps.
- Unlimited web analytics heatmaps
- Store heatmaps for 365 days
- GDPR-& CCPA-ready
For more information and details about WebMaxy Analyzer, connect with our experts on call or email us at info@beta.webmaxy.co.
Web analytics heatmap FAQs
How do you analyze a heatmap?
You can analyze a website heatmap by looking at the visual representation. The web analytics heatmaps are color-coded and you can analyze it by seeing the data points represented by different colors. Usually, the most interacted areas are presented with brighter colors, and the least clicked areas with the hue of blue.
How do I create a heat map in Google Analytics?
You can create a website heatmap in Google Analytics by adding the Page Analytics extension to Chrome. Then, you need to login to your GA account and integrate it with Page Analytics. Next, you need to browse your website data to view the web analytics heatmap data
What is the difference between web analytics heatmap and Google Analytics?
A web analytics heatmap is a graphical representation of the users’ clicks on your website. However, Google Analytics provide you with in-depth website data like traffic, page views, bounce rate, conversions, and more.
How do you analyze data using a web analytics heatmap?
You can analyze the clicks and scroll-down data using heatmap analytics. You can see where and on-which elements maximum users are clicking on your website. The scroll map can give you information on how much people are scrolling down on your web pages.
Can I view web analytics heatmap data in real-time?
WebMaxy Analyzer heatmaps can give you the visualization of the clicks data of users over time but not in real time. WebMaxy heatmaps start collecting the website visitors’ data from the moment you setup them.
Does Google Analytics do heat mapping?
No, Google Analytics don’t do heat mapping directly. However, you can use the Page Analytics chrome extension to generate click maps from the Google Analytics data. You need to add the Page Analytics extension to chrome and integrate it with your GA account.
Which analytical tool uses heatmap technology?
WebMaxy Analyzer is an web analytical tool that uses heatmap technology. You can create heatmaps for your distinct website pages and analyze your website visitors’ behavior. It also makes scroll maps that can help you to observe the scrolling pattern of users across different web pages.
Adam Wilson
Adam Wilson comes with an experience of 12+ years in the IT industry. As a Customer Success Manager, he has been researching and trying to understand the customers’ behavior in different scenarios. He has also studied human psychology to relate it to the purchase journey of the customers. His published books on customer psychology and behavior have received many honors and awards from various enterprises.
")
")

